I was honored to join the Harvard Kennedy School’s Anti-Racism Policy Journal team as both a contributing writer and editor for its second edition, released in the Spring of 2023. My writing contribution is below, and the entirety of the journal can be found here.
East Boston: Place-Based Racial Challenges & Opportunities in the City’s Most Geographically Isolated Neighborhood
Aubrey Hartnett-Haynes
East Boston, one of the City of Boston’s 23 neighborhoods (1), is separated from the rest of the city by water on most sides. Given its isolation from the rest of Boston, access to services and necessities within the neighborhood is essential. This paper explores East Boston’s origins, geography, and demographics to set the stage for a racial justice analysis of the neighborhood. It highlights parts of East Boston that make it unique (including its history and mix of identities, as well as its ecological vulnerability), and identifies the challenges and opportunities within this vibrant neighborhood. This topic is close to my heart as a longtime renting resident in the neighborhood. While this makes my anecdotal experience rich, I have enjoyed learning more about East Boston’s history and present in order to create a robust analysis.
East Boston’s History
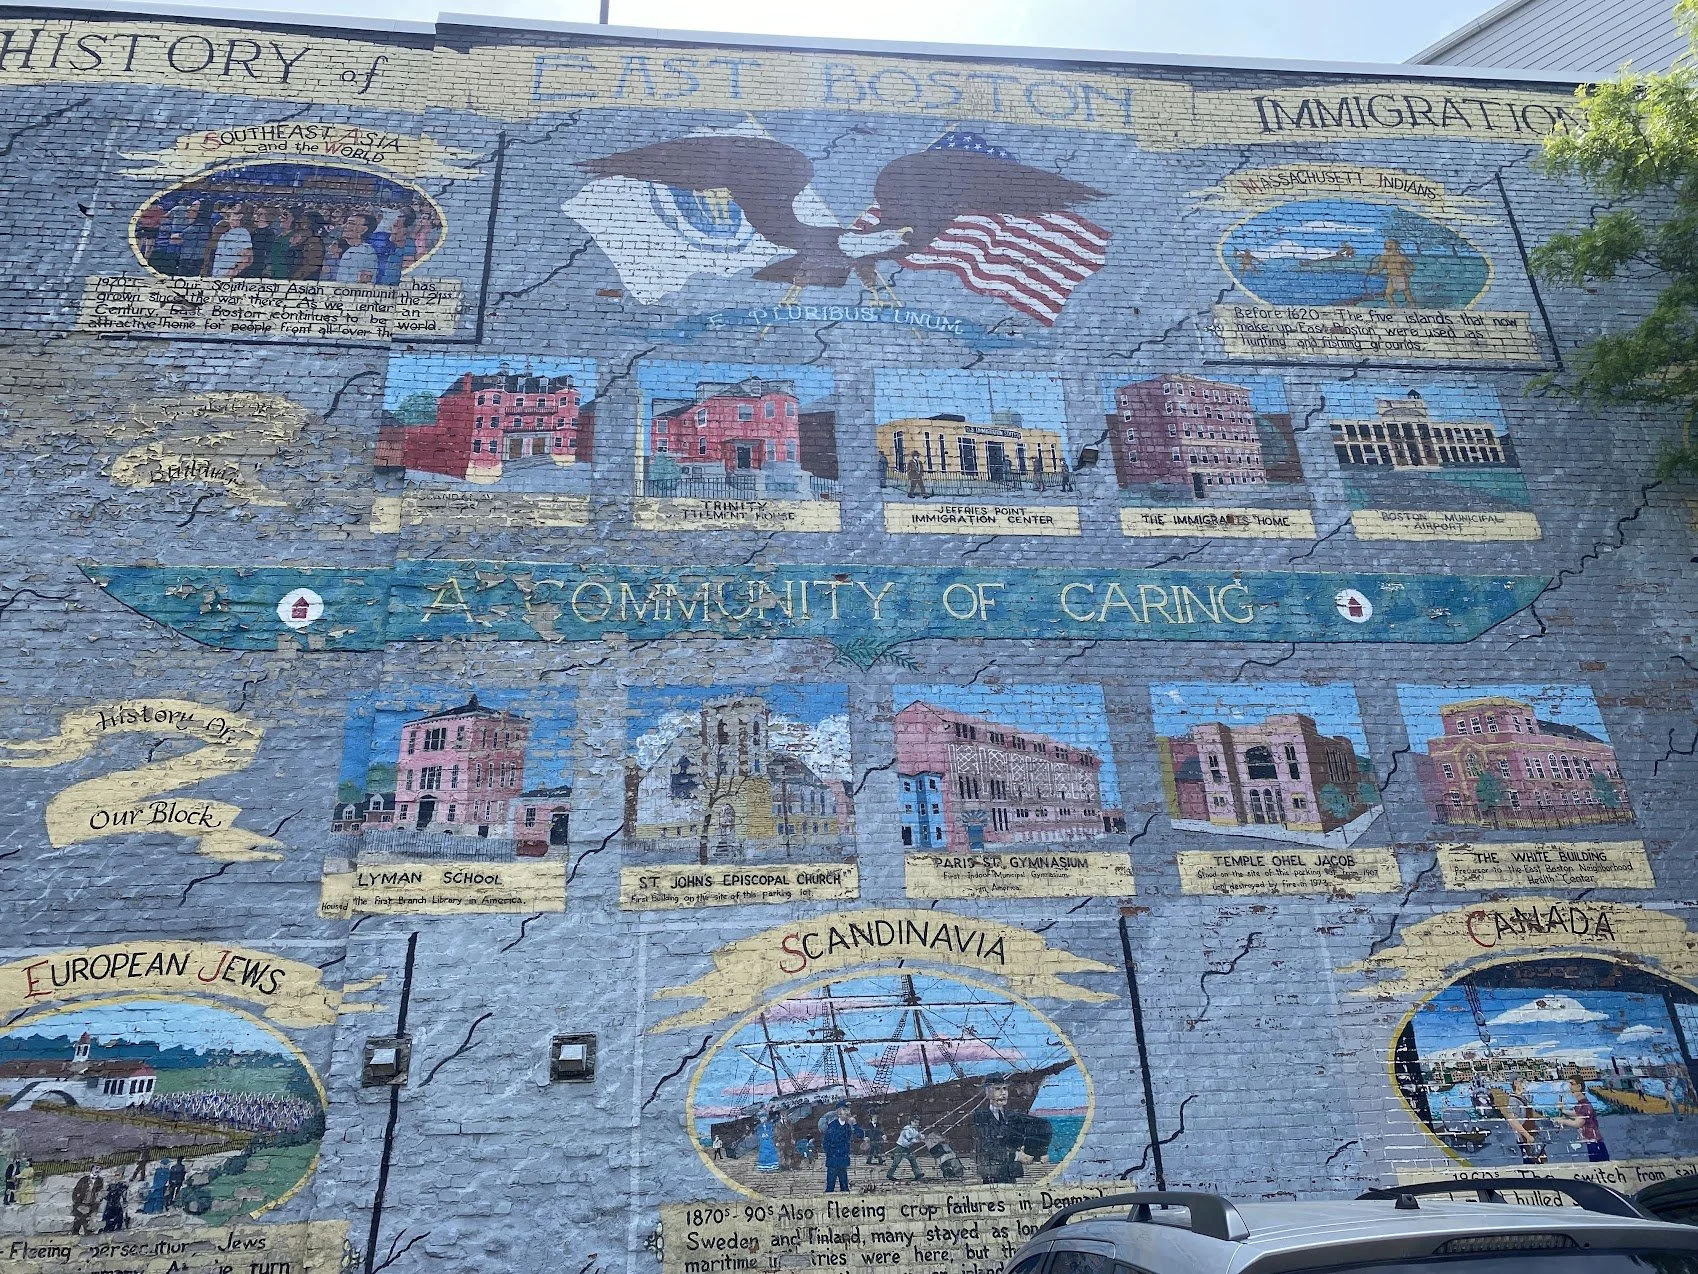
East Boston is a neighborhood of continuous change–of land and of peoples and has deep ties to colonial history. The land that now forms East Boston was original- ly five Boston Harbor islands that were developed and combined through landfilling in the 19th century. European-American settlement of these islands dated back to the 17th century with Samuel Maverick, a slave-owning settler to Noddle Island. From its initial development as one of the only neighborhoods that were formally planned, it has been an industrial and working-class neighborhood. This effort was spearheaded by General William H. Sumner in 1833, and his East Boston Company deeply influenced the neighborhood well into the 20th century.(2)
By the 1840s, Donald McKay, a Canadian immigrant to East Boston and designer of clipper ships, helped establish East Boston as a shipbuilding center. The early skilled shipbuilding residents largely came from Canada during the second half of the 19th century. Irish Catholics also came to East Boston in large numbers, working on building the infrastructure that would eventually connect East Boston by rail and streetcar to mainland Boston. East Boston became both a major port of entry for immigrants, similar to Ellis Island, with Portuguese, Jewish and Russian immigrants also arriving in the late 1800s and early 1900s.(3) Later, Italian Americans arrived in such numbers as to shift the dominant demographic identity of the neighborhood to its current form today.(4)
These days, East Boston is considered an Italian-American neighborhood experiencing rapid change yet again, which will be explored in the “Demographics” section. It continues to be a neighborhood with a majority of its residents born outside the United States, and with shifting working-class populations. Perhaps the most significant part of contemporary history to include here is proof of modern gentrification—East Boston’s explosion in development, particularly in luxury real estate—shifting the population in a new direction.(5)
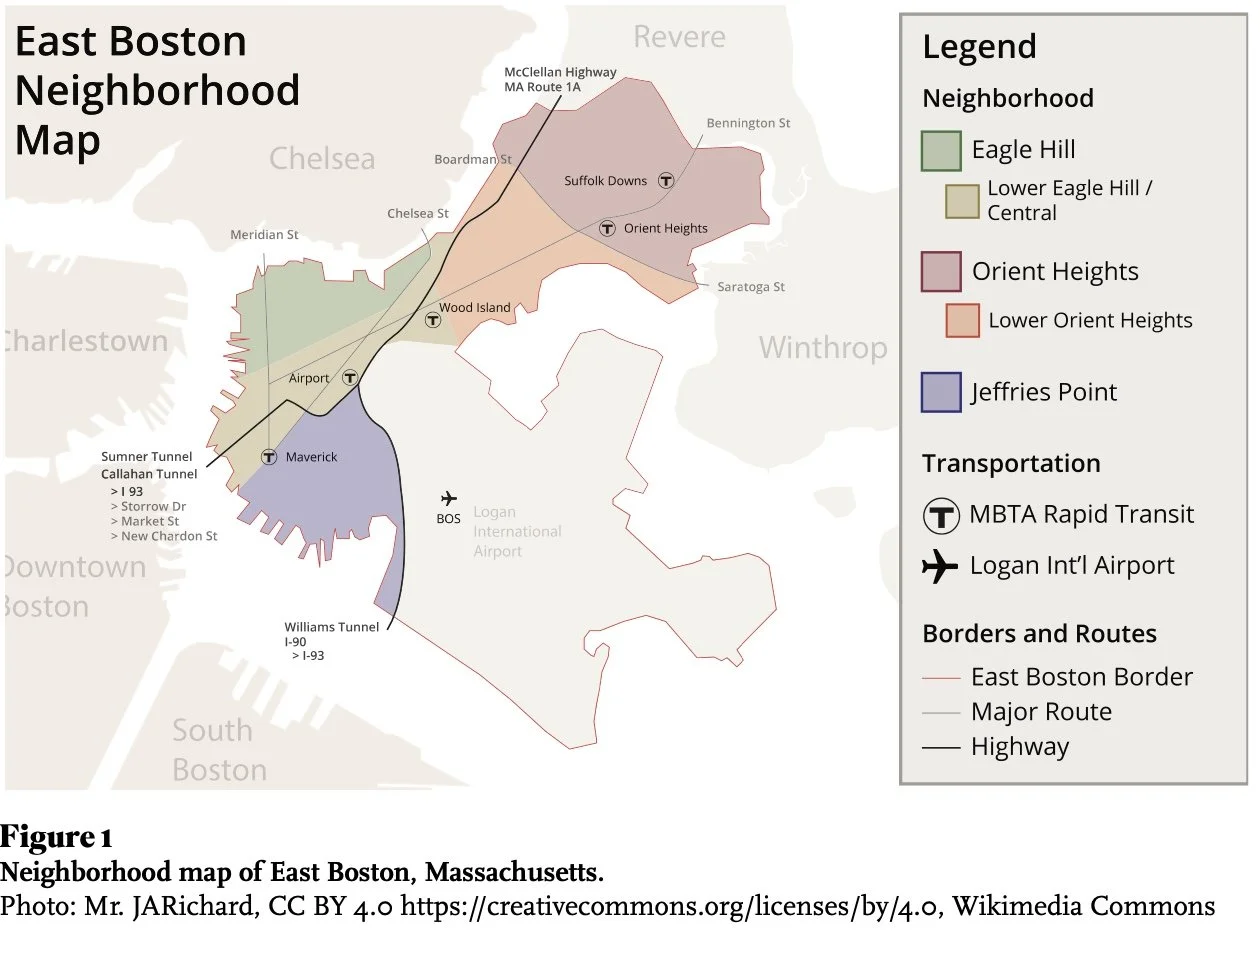
Significant to our understanding of East Boston is not only its coastal qualities, but also its relationship to international, national, and local transportation systems. East Boston is the site of Boston Logan International Airport and also serves as an international port of entry for sea travel. While this positions Boston for easy international and regional travel, East Boston’s land-travel options are more limited. As indicated by the map (Fig. 1) there are three (two of which are one-way travel) major tunnels, two land-connected highways, and a few bridges. While residents are allowed discounted rates on the tunnels and tolls in the area, this is an additional cost and consideration for East Bostonians.
While the majority of East Boston households do have access to or own at least one vehicle, many families do rely on public transit. Therefore, it is essential to understand the public transportation infrastructure to evaluate the needs and opportunities for East Bostonians. The only branch of the MBTA train system to reach East Boston is the Blue Line, and internal neighborhood public transit is largely served by city buses. Additionally, there are newly reestablished ferry options (which can be covered by certain MBTA fare schedules), as well as water taxi services, from East Boston to Downtown Boston for much of the year.
Understanding East Boston’s geography shows how vulnerable it is as a neighborhood to any disruptions in access. Whether due to accidents, flooding from storms worsening due to climate change, security threats, or work repairing aging infrastructure, closures massively impact the neighborhood. Additionally, most residents work outside of the neighborhood and East Boston only has one major grocery store. Therefore, access to surrounding neighborhoods and downtown is crucial for most residents’ daily life.
Another essential part of East Boston’s geography relates to its origins. As it is not a natural landform, but instead five islands combined by landfill–and the neighborhood of Boston with more coastline than any other–its ecological vulnerabilities are tied into its identity. Already, certain areas are subject to flooding during major storms, and structures and transportation are impacted. The climate crisis will likely have mounting impacts, particularly in the parts of East Boston constructed out of landfill.(6)
Demographics
As mentioned above, East Boston’s demographic identity has shifted dramatically over the years. Its significant immigrant population decreased during the middle of the 20th century as the Italian-American community became established over generations. Currently, over 50% of East Boston’s nearly 47,000(7) residents were born outside of the US. It is estimated that more than 35% of the total East Boston population is undocumented (and this is presumed to be an undercount).(8)
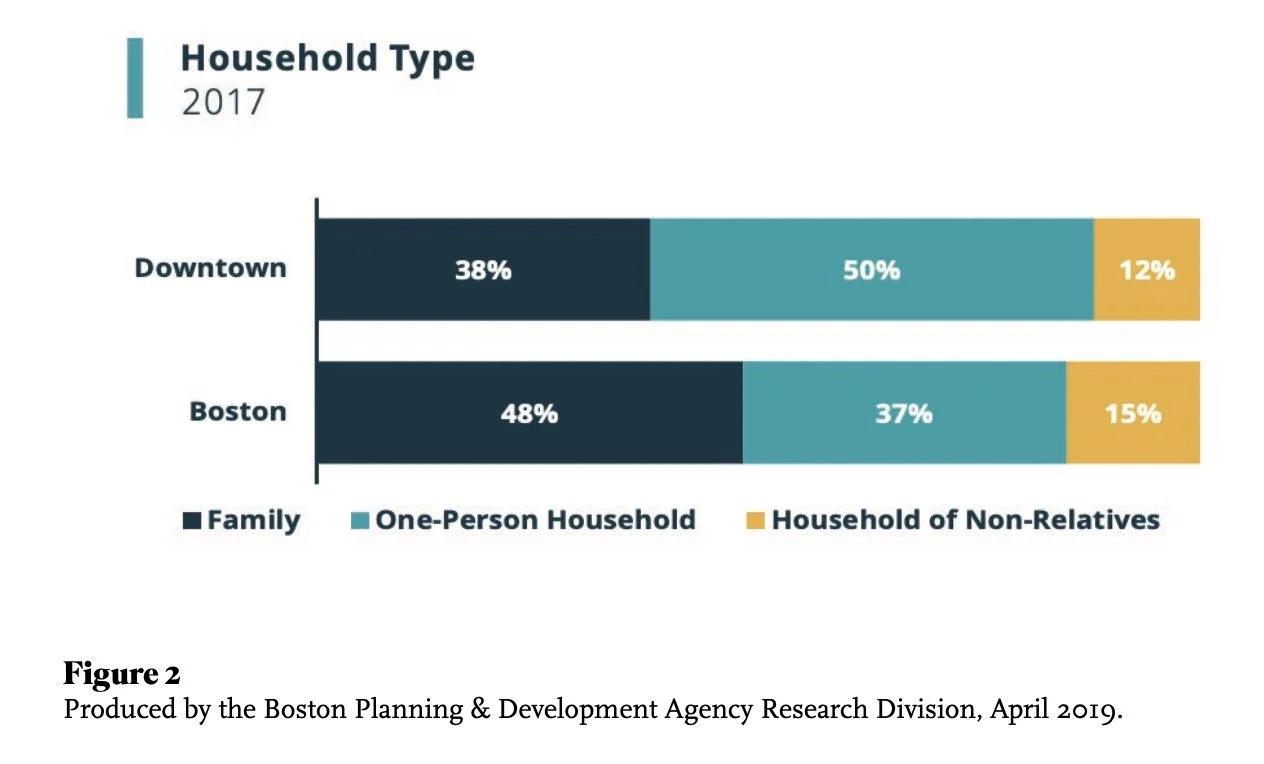
In comparison to the general Boston population, there are several differences of interest. The population of East Boston increased at a greater rate (17%) than the city average (10%) during the 2000-2015 period. The age distribution of the neighborhood includes a higher rate of children (21%) than the city’s average (16%).(9) Most of the immigrant population is from Latin America, with major waves of immigration dating back to 1989-1990. The share of Latino residents has grown dramatically since 2000, with the US Census Bureau reporting 26,063 East Bostonians of Hispanic or Latino origin in 2015. Almost half arrived from El Salvador, with Colombia, Mexico, Guatemala, and the Dominican Republic.(10) As shown in the bar chart (Fig. 2), the total proportion of the Latino population in East Boston (58%) compared to the city’s average of (19%) means the rest of the racial makeup of East Boston is different, too. The white population of East Boston accounts for 32% (Boston, 45%); the Black/African American population accounts for 2% (Boston, 23%); Asian and Pacific Islanders account for 4% (Boston, 9%); and “Other” accounts for 4% in both East Boston and the neighborhood. North Africans have immigrated and settled in East Boston in growing numbers, which adds to the religious and cultural diversity of the neighborhood.
East Boston also differs from the city average in work and income. While new luxury construction projects threaten to shift this reality, East Boston remains a working-class neighborhood. The percentage of East Bostonians ages 16 and above who are in the workforce is higher than the city average.(11) However, the average East Bostonian household’s income remains lower than the city average, with most residents employed in the food and other service sectors. Of jobs within the neighborhood, 46% are in transportation and warehousing.(12) During the COVID-19 pandemic, many East Boston residents continued to work outside of the home as essential workers, in addition to supporting their household needs through grocery shopping or going to food banks in-person rather than through delivery services (of note, many area delivery services charge extra for East Boston given the isolation and toll roads). Also, while average rents decreased in other Boston neighborhoods, they generally held steady and then began to rise in 2021 in East Boston, further pricing out long-time and lower-income residents.(13)
Notably, levels of education differ greatly compared to the rest of the city. In 2015, only 6% of East Boston residents were enrolled in college or university degree programs, and only about 21% of residents aged 25 and older had a bachelor’s degree or higher.(14) Many immigrants experience a disruption in schooling when they travel to the U.S. or their training from countries of origin does not transfer to existing workforce opportunities. With the additional challenges of language and cultural differences, it is unsurprising that East Boston’s reported levels of education are lower than the city average.
Place-based segregation persists in Boston. The Massachusetts Port Authority controls the majority of East Boston’s land, and much of the direct waterfront-leasing projects have been for large luxury condominiums. White and affluent populations are becoming more concentrated and their residency complicates issues of public access to waterfront. In response to what long-time residents perceive as rampant development that has largely left out the interests and voices of the working-class local population, there are deep concerns about further development, including for climate-resilient projects, that may have unintended consequences of further privatization, limited access, and division between the various populations within East Boston.(15) Residents sense the change and destabilization in East Boston. Concerns of housing and livelihoods often outweigh all other issues.
Putting Data Into a Racial Justice Context
As discussed above, East Boston’s enviable real estate market with waterfront luxury properties mixed with its vulnerability to climate change has meant that it has received no shortage of public attention. However, these data points need to also be put in the context of racial justice to ensure that growing inequities are not further exacerbated.
Childcare, Education & Livelihoods
First, in terms of basic services like childcare and education, East Boston’s isolation from the rest of Boston is significant. As the mother of two small children who are in school and care in the neighborhood, I have experienced this first-hand before the pandemic up to today. The discrepancy of available spots to children is a more significant problem in East Boston than in other Boston neighborhoods (this is not to say it is not also an issue elsewhere!) There are 3,109 children under the age of five, with only 1,676 formally licensed available spots. This discrepancy is even more stark for children under the age of two. While data is lacking for the full distribution of childcare access across racial and ethnic lines, one of the most significant barriers to these limited spots is cost. Non-white residents of East Boston are more likely to be lower-income, and families with undocumented members face additional vulnerabilities. The voucher system has a long waitlist, meaning licensed childcare options are out of reach. Significantly, in the City of Boston’s latest childcare census, only 9.2% of parents said their ideal care arrangement was as primary caregivers, but 28.2% stated that as their current arrangement.(16) This means the most vulnerable and lowest earners are likeliest to have their livelihoods and earning opportunities limited - and this is especially true of single-parent households.
Another significant trend is in the makeup of the East Boston High School (EBHS) population. Whereas the racial/ethnic breakdown of the neighborhood as a whole is 58% Latino, over 80% of EBHS students are Latino. The vast majority do not speak English as a first language (77.7%), are from low-income households (76.1%), and are classified as high needs (91.4%).(17) The only other high school option within East Boston is an Excel Academy charter school. Wealthier, white students are more likely to access exam schools in the Boston Public School system, as well as private school options.(18)
The gap between white and non-white students in East Boston schools may stem from numerous causes. One may be the awareness of options and how to navigate them. More affluent, white families are more likely to know the full range of public and private options available, as well as the systems for accessing them. While a neighborhood with so few residents pursuing two- or four-year degrees might show a preference for vocational and technical school programs, the only option is far from East Boston and appears to have attracted more white students than students of other racial backgrounds.(19) EBHS does provide some job training and vocational skills options for students(20), and there are other local organizations such as Maverick Landing Community Services that provide leadership and skills trainings for East Boston teenagers.(21) Another concern, in regards to EBHS, is the presumption that charter schools provide better education and opportunities and outcomes for students.(22)
Students with younger siblings and/or with after-school jobs may not feel the same opportunity to explore a range of educational options within East Boston and beyond. If families rely on older children to provide or facilitate care and employment, that may limit their ability to leave the neighborhood, highlighting the need for robust networks of care and support within East Boston.
While EBHS has a lower drop-out and higher graduation rate than the Boston Public School average, the neighborhood does not send as many of its teenagers to two- or four-year colleges and universities.(23) Though there are no higher education institutions within East Boston, there are many options in and around the city, often easier to access than the other Boston high schools available to residents. In a neighborhood with lower-than-average incomes, the cost of higher education is the most common limiting factor.(24)
Jobs & Transportation
Adult residents of East Boston may experience difficulty finding a job because of the limited transportation options and their immigration status. Many residents travel into other neighborhoods of Boston for restaurant and other blue-collar work, relying on public transportation. The challenges of unreliable infrastructure and the increasingly frequent impacts of climate change through flooding leaves workers vulnerable if these failures make them late to work, especially as many lower-wage workers do not have jobs that allow them to work from home.
Community Organizations
East Boston has a robust network of social services and community organizations. The siloed nature of many organizations presents challenges to coordinated action. Communities have created networks of support for themselves through culturally specific organizing. One of the challenges this creates is in the ability of any given family to find services that meet their needs, and any given organization to have the resources necessary. Especially during the period of the pandemic marked by lockdowns and school closures, city-based services, such as those provided through Boston Centers for Youth and Families (BCYF) were completely halted. The neighborhood is still rebuilding these programs and necessary resources, including culturally competent staff.
Conclusion
East Boston is unique in many ways due to its geographic isolation and climate vul- nerability. Its residents have these challenges amplified through a lack of attention and access and resources. Given East Boston’s particular vulnerabilities, the City of Boston should support it more robustly by implementing policy with an anti-racist intent. The neighborhood would also benefit from the coordination of culturally-responsive resources to allow families to care for their children and elderly, allow their school-aged members to access quality education, and for their working-aged members to access good jobs and other livelihood opportunities. By using a racial justice lens to examine what makes East Boston different from other parts of Bos- ton, it is possible to see these challenges and better services, improve infrastructure and provide additional support.
Notes
1. https://www.boston.gov/departments/neighborhood-services
2. Exploring Boston’s Neighborhoods: East Boston and Global Boston Project
3. Ibid.
4. Ibid.
5. Opportunity in the Complexity: Recommendations for Equitable Climate Resilience in East Boston
6. Opportunity in the Complexity
7. Per 2013-2018 American Community Survey (Neighborhood Profile - see Appendix)
8. Opportunity in the Complexity (28), Hispanics in the Neighborhood RIT Report
9. Neighborhood Profile and East Boston Trends, See Appendix Figures 1-4
10. Hispanics in East Boston, RIT Report (10)
11. East Boston Trends (See Appendix Figure 4)
12. (https://www.bostonplans.org/getattachment/f719d8d1-9422-4ffa-8d11-d042dd3eb37b) Additionally, for every resident worker only 0.81 jobs within East Boston. Same source
13. https://bostonpads.com/blog/boston-rental-market/2022-east-boston-apartment-rental-market-report/ + https:// www.wbur.org/news/2021/09/17/greater-boston-rental-housing-allston-covid
14. East Boston Trends (See Appendix Figure 4)
15. Opportunity in the Complexity 137
16. Ashley White, Adam Jones and Samiya Khalid, “Making Child Care Work: Results From the 2021 Child Care Census Survey,” City of Boston, 2021, 6.
17. https://profiles.doe.mass.edu/profiles/student.aspx?orgcode=00350530&orgtypecode=6, https://reportcards.doe. mass.edu/2021/00350530
18. https://www.bostonglobe.com/2023/04/28/metro/bps-exam-school-admissions-errors/
19. https://www.wbur.org/news/2023/02/02/admissions-policy-massachusetts-vocational-students-federal-civ- il-rights-complaint-marginalized-students
20. https://www.ebhsjets.net/apps/pages/index.jsp?uREC_ID=321627&type=d
21. https://mlcsboston.org/youths
22. Opportunity in the Complexity
23. https://www.bostonglobe.com/2022/12/01/metro/once-underperforming-east-boston-high-school-made-gains- through-pandemic-can-bps-replicate-success/
24. Resilience report

